Methods and techniques:
Experimental methods:
Laboratory: experiment conducted in a controlled environment (not always a laboratory) allowing accurate measurements to be made. The research decides where the experiment will take place, who with, at what time, for how long and in what circumstances.
Advantages: control for variables, manipulate the variables, relatively easy to repeat, often cheaper and less time-consuming than other methods
Disadvantages: artificial environment, not real world, Hawthorne effect, experiment can be bias to researchers demands, does not recognise that variables in the real world change all the time, cause and effect can go wrong
Field experiments: conducted in everyday and natural environments, but situations are still artificially set up
Advantages: people may behave more naturally, less chance of the Hawthorne effect, less chance of researcher bias
Disadvantages: independent variable not controlled by the researcher, no control over the allocation of participants to groups, possible to have lots of outside distractions within the environment
Natural experiments: conducted in the everyday life of participants, but the researcher has no control over the independent variable as it occurs naturally
Strengths: behaviour is more likely to reflect real life, less likely to face the Hawthorne effect as participants not aware that they are being observed, can be used in situations where it would be ethically unacceptable to manipulate the independent variable
Weaknesses: can be more expensive and time consuming, no control over extraneous variables
Correlational analysis: a statistical technique used to explore the strength of relationship between two variables (for example Murstein (1972) carried out a correlation analysis of ratings of attractiveness in partners ('computer dance' study))
-if both variables increase together it is a POSITIVE CORRELATION
-if one variable increases but the other decreases it is a NEGATIVE CORRELATION
-if no line of best fit can be drawn there is NO CORRELATION
Strengths: able to calculate the strength of relationship between two variables, useful as a pointer for more detailed research
Weaknesses: cannot assume cause and effect, strong correlation can be misleading, lack of correlation may not necessarily mean there is no relationship
Observational techniques:
Covert observations = when the researcher pretends to be an ordinary person within the group and observes what goes on
Overt observations = when the researcher tells the group that they are conducting research and observing
Natural observations = spontaneous behaviour recorded in a natural setting
Controlled observations = behaviour observed under controlled conditions
Participant observations = the observer has direct contact with the people they are observing
Self-report techniques:
Questionnaire:
Strengths - lots of people tested quickly, can collect large amounts of data, convenient, can quickly show changes in attitudes
Weaknesses - people say what they think looks good, people may not tell the truth, low response rate may be a problem, difficult to phrase questions clearly, difficulty avoiding leading questions
Interviews:
Strengths - detailed information can be obtained, greater attention to individuals point of view, can ask further questions if answers are interesting and need expanding upon, unstructured and casual interviews may encourage openness of answers
Weaknesses - difficult to analyse, time consuming, interviewer effects
Case studies: Case studies are in-depth investigations of a single person, group, event or community. (data gathered from a variety of resources)
Strengths - very detailed information is gathered, comparisons can be made of the case study (longitudinal), useful in studying something over a long period of time (longitudinal)
Weaknesses - hard to generalise as usually on one specific person or group, often on people or something with a rare characteristic so hard to generalise, studies are very limited, can be very time consuming (longitudinal)
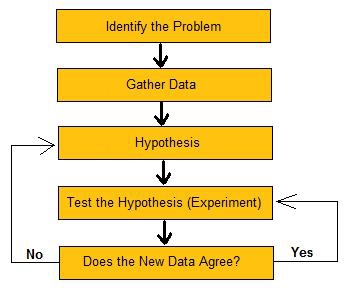
Investigation design:
Aims = what the research intends to do/look at/investigate
Hypothesis = an educated assumption about the outcome of the research
(Directional hypothesis = a statement made about the specific nature of the relationship of two or more variables)
(Non-directional hypothesis = a statement that a relationship exists between two variables, without predicting the exact nature (direction) of the relationship)
Experimental design = Independent group = testing separate groups of people, each group is tested in a different condition. Repeated measures = the same participants take part in each condition of the independent variable. Matched pairs = one pair randomly assigned to the experimental group and one to the control group)
Naturalistic observations = observing someone or something in their natural environment, for example, Lorenz (1937): Famous studies on imprinting in animals.)
Independent variables = a variable that stands alone and is not changed by other variables e.g. age
Dependent variables = a variable that depends on other factors e.g. scores in a test, as performance may be affected by how much sleep got and revision someone did
Pilot studies = a small mock up of the research that is going to take place, to allow the researcher to identify any flaws within the research design
Reliability = consistency of a measure
Validity = the extent to which a finding corresponds well with the real world
British Psychological Society (BPS) Code of Ethics = issued codes of ethics in Psychology
Ethical issues = a problem or situation that requires an alternative or an evaluation of whether it is right or wrong
Sampling -
Random sampling = members of population have an equal chance of being selected
Opportunity sampling = Uses people from target population available at the time and willing to take part. It is based on convenience.
Volunteer sampling = the sample consists of people who volunteer or ask to take part
Demand characteristics = can change the outcome of an experiment because participants will often alter their behavior to conform to the experimenters expectations
Investigator effects = the researcher may, at an unconscious level, behave in such a way as to bring about their prediction
Data analysis and presentation
Presentation of quantitative data = graphs, scatter grams and tables
Interpretation of quantitative data:
-Measures of central tendency = A number which describes the bulk of the scores in a given distribution
-Mean = The mean is the total of the numbers divided by how many numbers there are
-Median = The median is the middle value
-Mode = The most
-Range = difference between the biggest and smallest number
-Standard deviation = a measure of how spread out numbers are
Content analysis = observing words, images or concepts in media texts
Pedagogy
Ask pupils to design a grid/poster (design of their choice) and outline different experimental methods and their advantages and weaknesses and also identify a famous study that has used one of these designs
Describe different studies and ask pupils which method the study used and why they though this would be the best design
Use Big Brother as an example of a research design - ask the pupils to describe how this is a piece of research
Investigation design - ask pupils to think of a piece of research they wish to research into - ask them to use the investigation design template to design the piece of research (also set this as an extension for homework task)
When the pupils have planned the investigation design ask them to write up their piece of research into an essay format (pretending that they had conducted the research thus incorporating what may have gone well/wrong and proposals for further research)
http://www.simplypsychology.org/research-methods.html
http://www.sparknotes.com/psychology/psych101/researchmethods/section1.rhtml
http://www.s-cool.co.uk/a-level/psychology/research-methods
http://www.bps.org.uk/
Experimental methods:
Laboratory: experiment conducted in a controlled environment (not always a laboratory) allowing accurate measurements to be made. The research decides where the experiment will take place, who with, at what time, for how long and in what circumstances.
Advantages: control for variables, manipulate the variables, relatively easy to repeat, often cheaper and less time-consuming than other methods
Disadvantages: artificial environment, not real world, Hawthorne effect, experiment can be bias to researchers demands, does not recognise that variables in the real world change all the time, cause and effect can go wrong
Field experiments: conducted in everyday and natural environments, but situations are still artificially set up
Advantages: people may behave more naturally, less chance of the Hawthorne effect, less chance of researcher bias
Disadvantages: independent variable not controlled by the researcher, no control over the allocation of participants to groups, possible to have lots of outside distractions within the environment
Natural experiments: conducted in the everyday life of participants, but the researcher has no control over the independent variable as it occurs naturally
Strengths: behaviour is more likely to reflect real life, less likely to face the Hawthorne effect as participants not aware that they are being observed, can be used in situations where it would be ethically unacceptable to manipulate the independent variable
Weaknesses: can be more expensive and time consuming, no control over extraneous variables
Correlational analysis: a statistical technique used to explore the strength of relationship between two variables (for example Murstein (1972) carried out a correlation analysis of ratings of attractiveness in partners ('computer dance' study))
-if both variables increase together it is a POSITIVE CORRELATION
-if one variable increases but the other decreases it is a NEGATIVE CORRELATION
-if no line of best fit can be drawn there is NO CORRELATION
Strengths: able to calculate the strength of relationship between two variables, useful as a pointer for more detailed research
Weaknesses: cannot assume cause and effect, strong correlation can be misleading, lack of correlation may not necessarily mean there is no relationship
Observational techniques:
Covert observations = when the researcher pretends to be an ordinary person within the group and observes what goes on
Overt observations = when the researcher tells the group that they are conducting research and observing
Natural observations = spontaneous behaviour recorded in a natural setting
Controlled observations = behaviour observed under controlled conditions
Participant observations = the observer has direct contact with the people they are observing
Self-report techniques:
Questionnaire:
Strengths - lots of people tested quickly, can collect large amounts of data, convenient, can quickly show changes in attitudes
Weaknesses - people say what they think looks good, people may not tell the truth, low response rate may be a problem, difficult to phrase questions clearly, difficulty avoiding leading questions
Interviews:
Strengths - detailed information can be obtained, greater attention to individuals point of view, can ask further questions if answers are interesting and need expanding upon, unstructured and casual interviews may encourage openness of answers
Weaknesses - difficult to analyse, time consuming, interviewer effects
Case studies: Case studies are in-depth investigations of a single person, group, event or community. (data gathered from a variety of resources)
Strengths - very detailed information is gathered, comparisons can be made of the case study (longitudinal), useful in studying something over a long period of time (longitudinal)
Weaknesses - hard to generalise as usually on one specific person or group, often on people or something with a rare characteristic so hard to generalise, studies are very limited, can be very time consuming (longitudinal)
Investigation design:
Aims = what the research intends to do/look at/investigate
Hypothesis = an educated assumption about the outcome of the research
(Directional hypothesis = a statement made about the specific nature of the relationship of two or more variables)
(Non-directional hypothesis = a statement that a relationship exists between two variables, without predicting the exact nature (direction) of the relationship)
Experimental design = Independent group = testing separate groups of people, each group is tested in a different condition. Repeated measures = the same participants take part in each condition of the independent variable. Matched pairs = one pair randomly assigned to the experimental group and one to the control group)
Naturalistic observations = observing someone or something in their natural environment, for example, Lorenz (1937): Famous studies on imprinting in animals.)
Independent variables = a variable that stands alone and is not changed by other variables e.g. age
Dependent variables = a variable that depends on other factors e.g. scores in a test, as performance may be affected by how much sleep got and revision someone did
Pilot studies = a small mock up of the research that is going to take place, to allow the researcher to identify any flaws within the research design
Reliability = consistency of a measure
Validity = the extent to which a finding corresponds well with the real world
British Psychological Society (BPS) Code of Ethics = issued codes of ethics in Psychology
Ethical issues = a problem or situation that requires an alternative or an evaluation of whether it is right or wrong
Sampling -
Random sampling = members of population have an equal chance of being selected
Opportunity sampling = Uses people from target population available at the time and willing to take part. It is based on convenience.
Volunteer sampling = the sample consists of people who volunteer or ask to take part
Demand characteristics = can change the outcome of an experiment because participants will often alter their behavior to conform to the experimenters expectations
Investigator effects = the researcher may, at an unconscious level, behave in such a way as to bring about their prediction
Data analysis and presentation
Presentation of quantitative data = graphs, scatter grams and tables
Interpretation of quantitative data:
-Measures of central tendency = A number which describes the bulk of the scores in a given distribution
-Mean = The mean is the total of the numbers divided by how many numbers there are
-Median = The median is the middle value
-Mode = The most
-Range = difference between the biggest and smallest number
-Standard deviation = a measure of how spread out numbers are
Content analysis = observing words, images or concepts in media texts
Pedagogy
Ask pupils to design a grid/poster (design of their choice) and outline different experimental methods and their advantages and weaknesses and also identify a famous study that has used one of these designs
Describe different studies and ask pupils which method the study used and why they though this would be the best design
Use Big Brother as an example of a research design - ask the pupils to describe how this is a piece of research
Investigation design - ask pupils to think of a piece of research they wish to research into - ask them to use the investigation design template to design the piece of research (also set this as an extension for homework task)
When the pupils have planned the investigation design ask them to write up their piece of research into an essay format (pretending that they had conducted the research thus incorporating what may have gone well/wrong and proposals for further research)
http://www.simplypsychology.org/research-methods.html
http://www.sparknotes.com/psychology/psych101/researchmethods/section1.rhtml
http://www.s-cool.co.uk/a-level/psychology/research-methods
http://www.bps.org.uk/
|
|
|
|
|
